
League Wide Cash Spending

Hello everyone, TC here.
If you are a new subscriber to the Cap & Trade Newsletter, welcome! This newsletter covers the NFL salary cap and roster construction across the league with additional coverage of the Houston Texans. I’ve been covering the Houston Texans since 2012, and have been working at OverTheCap.com for the past 7 years. I hope you find this newsletter informative and digestible. I do subscribe to a number of paywall-type websites for data sourcing and aggregation. While this newsletter remains free, you can donate to the cause at the button below:
In this edition of the Cap & Trade Newsletter I wanted to take a look at cash spending across the league for 2023 league year at the different position groups. To set the stage, I need to clarify a few things:
Cash Spending ≠ Salary Cap Spending
Cash spending in the data below is for 90 player rosters.
The cash spend number will drop once the rosters are trimmed back to 69 players.
Cash spending in the data below is for the 2023 league year.
Defensive Line includes players designated as Defensive End, Defensive Tackle, and Edge players. Linebackers are considered off the ball linebackers.
Defensive Backs includes players designated as Cornerback, Slot Back, and Safety.
All data courtesy of OverTheCap.com
Links to charts and tables will be at the bottom of the newsletter for interaction.
Cash Over Cap
Yes it is true, the NFL does set a hard cap on the salary cap spending. This hard cap does not extend to cash spending. If you have been reading/watching my work you’ll know that I describe the salary cap as an accounting function of the cash spent by an NFL organization; how the teams allocate their cash spending across the salary cap.
Across the thirty two NFL organizations, the average team cash spending is projected at $243,584,025 on a league salary cap of $224,800,000.
Average League Wide Cash To Cap Ratio: 1.08. This ratio represents a Cash Over Cap spending.
Total cash spending across the league is $7,794,688,800!
The Collective Bargaining Agreement (CBA) has two specific requirements in terms of cash spending for the NFL teams:
Teams, as a whole, must spend 95% of the league salary cap in cash each year. As we can see above with the Cash To Cap Ratio, that is easily achieved.
Individual teams must spend 90% of the league salary cap in cash over a three year period. 2023 is the third year in the spending window.
Spending By Position
This just in…NFL teams spend heavily at the quarterback position. Almost double on average per player.

The data in this table aligns with the general consensus on roster construction at a high level. Quarterback first, build in the trenches second, followed by skill positions.
I expected defensive backs to be higher up on this chart. The pay disparity between outside cornerback and safety contributed to their placement within the table above.
As an aside reference, below is APY growth by position, which provides insight into the disparity between Cornerback and Safety.

Cash Spending By Team
Cash spending by team across the position groups are listed in the table below. The amounts will vary over 2 and 3 year windows due to rookie contracts; and with timing of new contracts with veteran players. This variation is even more apparent with smaller position groups like Quarterback.
For example: Houston Texans with two rookie contracts with a third low cost veteran compared to the Baltimore Ravens who just executed a top of the market contract with Lamar Jackson which includes a $72.5 million signing bonus.
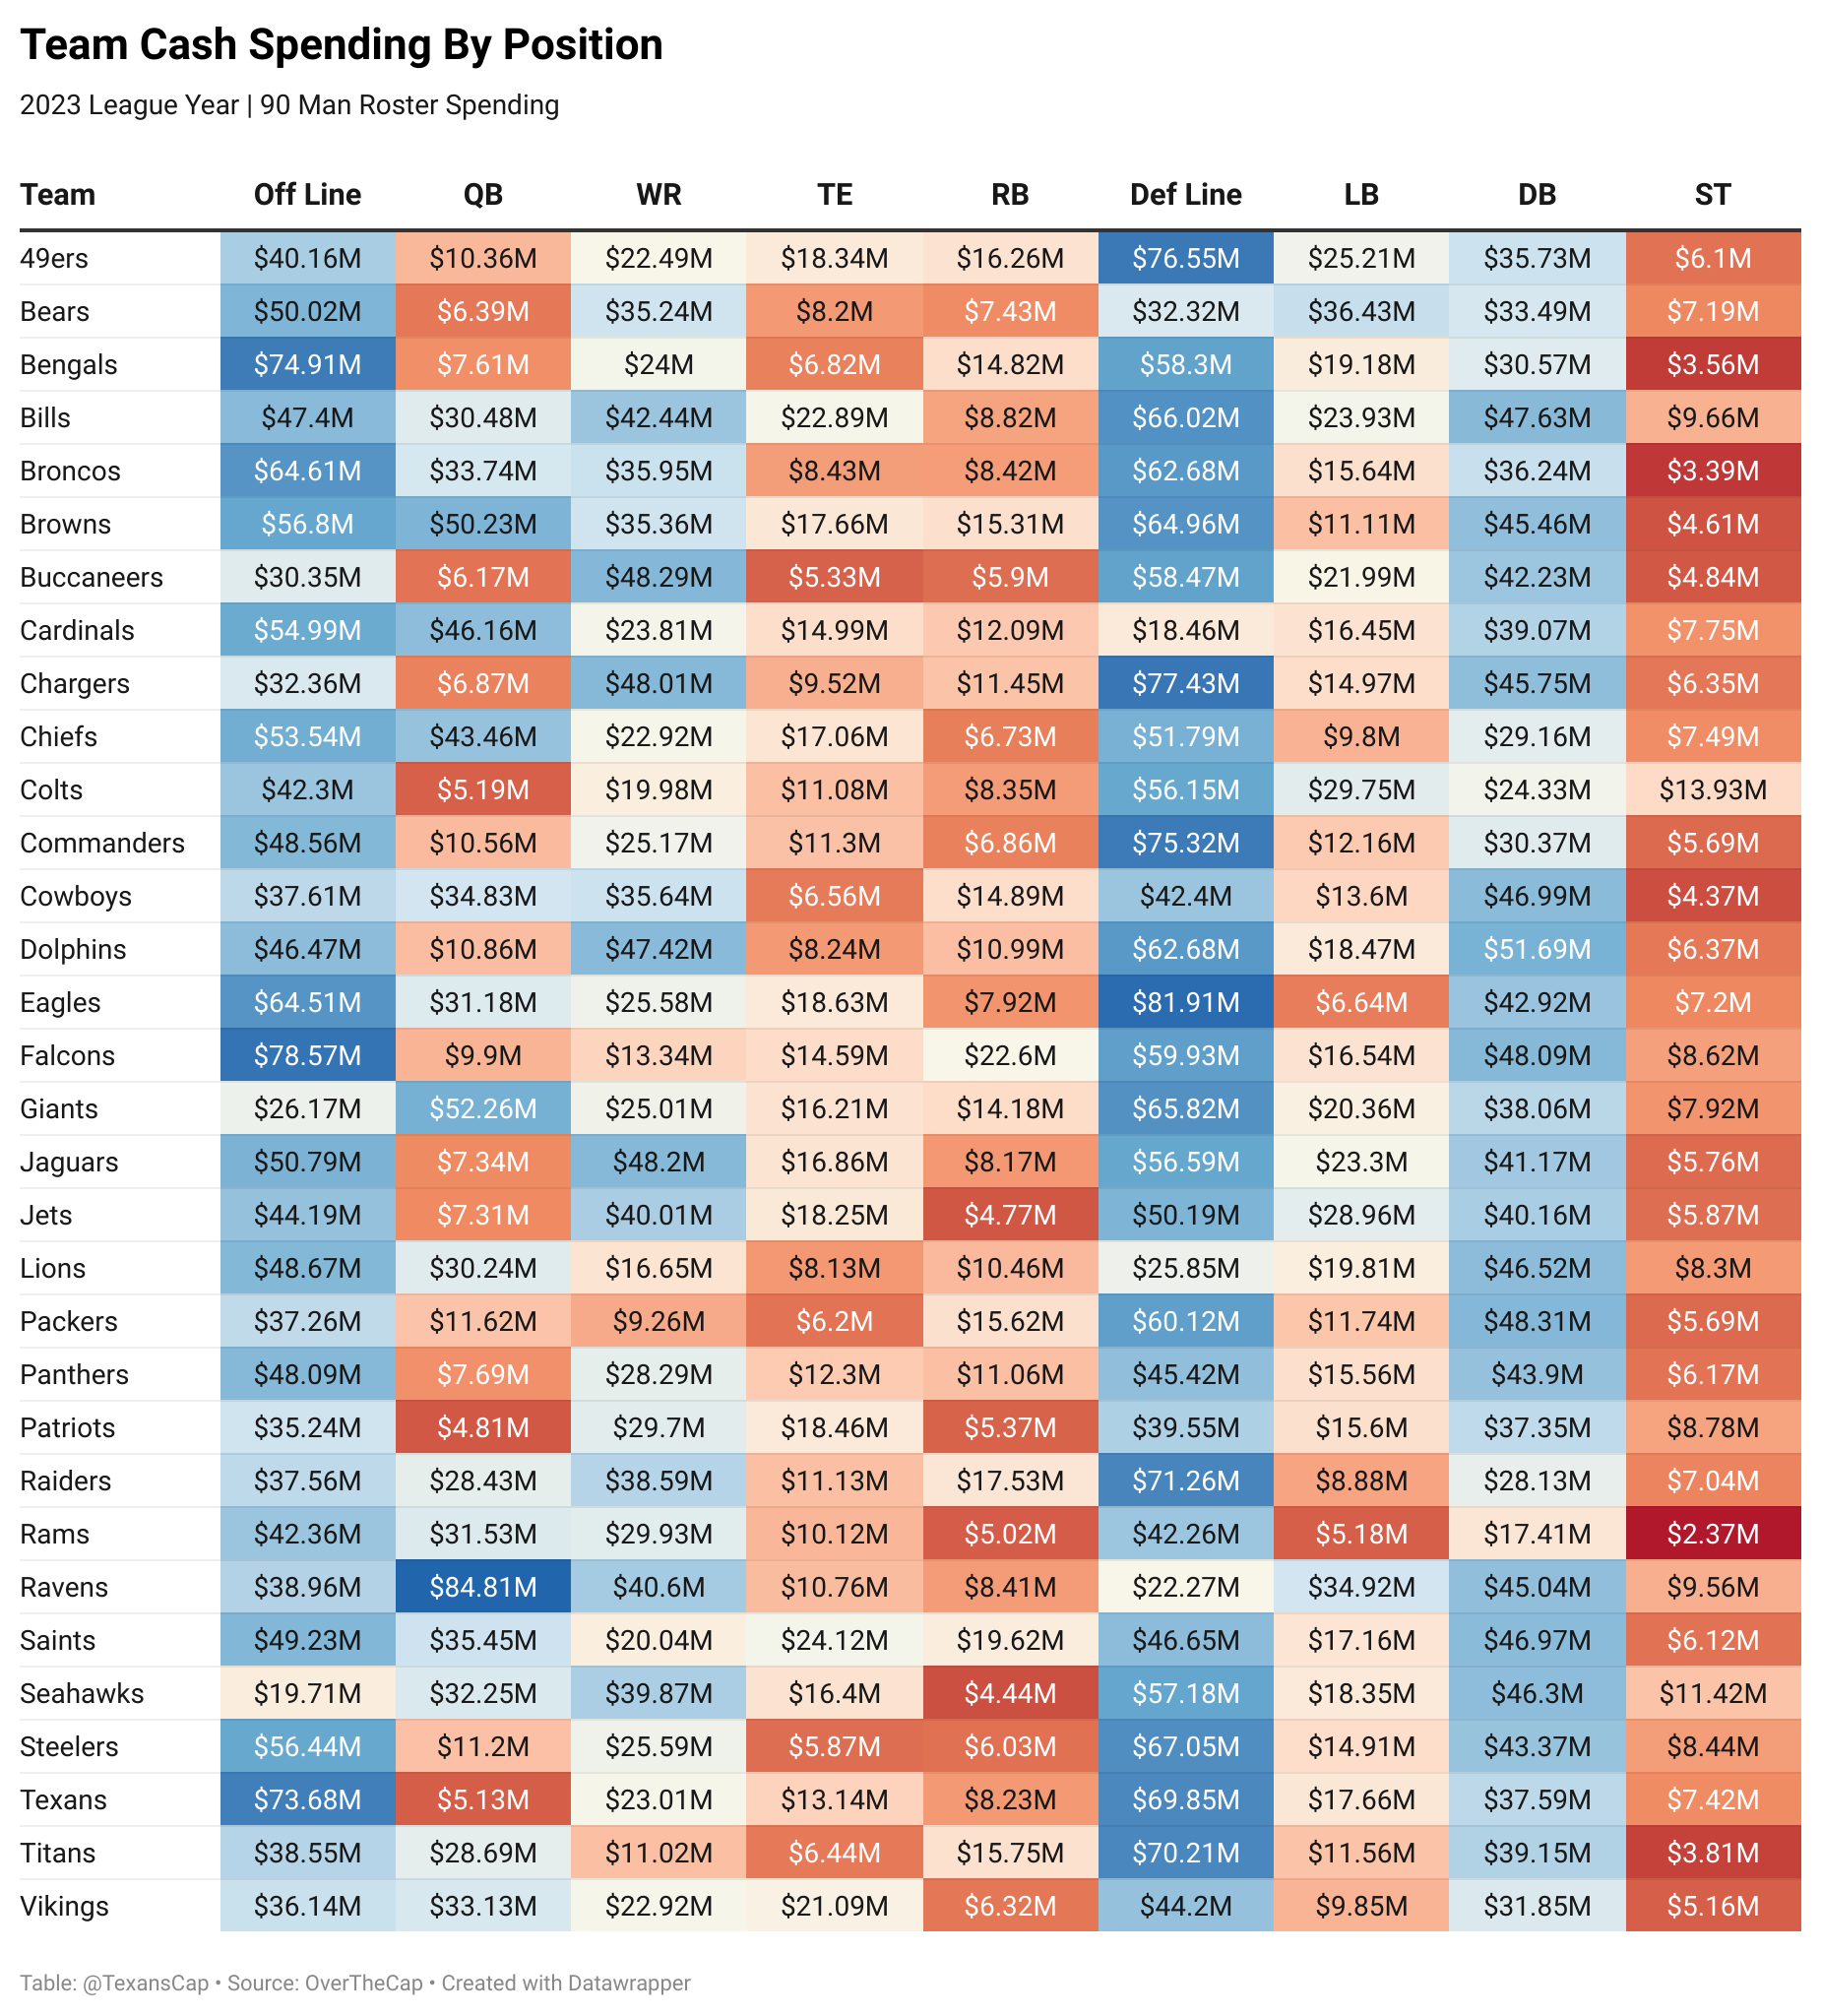
Teams appear to be in two buckets when it comes to cash spending. This is based on their respective quarterback situation, specifically a rookie contract versus a veteran player contract.
If the team has a starting quarterback on a rookie contract, spending on that position group will be low with the remainder of the money distributed across the roster.
Teams with a veteran high priced quarterback will mean less money for the rest of the roster. Teams in this situation not only have to spending wisely (however you want to define that), but teams will need success from their draft classes.
Cash Spending Equate To More Wins?
This is the question I receive the most year after year. Fans expecting their respective team to go heavy in free agency or trade for a specific player…whatever it takes to improve the roster.
If a team spends more cash, will the team win more games? Based on cash spending alone, the answer is No. There is no correlation to the amount of teams wins compared against cash spending.

This plot covers the 2011 through 2022 league years, comparing regular season team wins against the total amount of cash spent. If you wanted to drop a trend line on this chart, it will be flat indicating no correlation.
Referencing a previous newsletter on APY surplus value (read here), there is a clear takeaway that coaching matters. I would go as far as saying coaching and quarterback play are the two leading indicators towards team wins.
Historical Efficiency of Cash to Wins
Take a look at the teams below over the same 2011 - 2022 time period. In most situations a stable quarterback + stable coaching staff garnered the most wins.

Summary
Just dropping loads of cash into your roster does not provide sustained winning for an organization. Going crazy in March during free agency rarely provides a long term solution.
Referencing the differences in cash spending by team over the years is a clear reminder that teams do have cash budgets. Some teams are cash limited compared to other teams. Cincinnati, Indianapolis, and Los Angeles Chargers generally have a lower cash spend budget compared to Atlanta, Los Angeles Rams, Philadelphia, and Cleveland.
Roster building, coaching, and salary cap allocation are just some of the key factors into building a successful NFL team.
Thanks for reading!
-TC