

Hey everyone, TC here.
Football is an incredibly complicated game.
There are 22 players on the field, multiple individual assignments, play calls, personnel decisions, down-and-distance situations, field position, injuries, penalties, turnovers, and occasionally just plain luck that can influence the outcome of a game.
But what if we could simplify all of that?
What if there were three statistics that could tell us, with a pretty high degree of confidence, which team controlled the game?
I started looking at three metrics that I have increasingly come back to when evaluating NFL games:
Time of Possession Margin
Toxic Differential
Net Success Rate
Individually, these statistics tell part of the story behind the outcome. But when you put the three together, something interesting happens. The team that wins all three areas wins the football game at an extremely high rate. And I think there is a good football reason why.
Key #1: Control the Football
Time of possession is one of those statistics that can quickly turn into a chicken-or-the-egg argument.
Did a team win because it controlled the football, or did it control the football because it was winning? A fair question indeed.
I don’t think simply looking at raw time of possession tells us very much. A team can possess the ball for 34 minutes because it sustained drives all game. A team can also possess the ball for 34 minutes because it was protecting a two-score lead in the fourth quarter.
But possession margin becomes more interesting when we combine it with the other two metrics.
A positive time of possession margin generally tells us one team was able to stay on the field longer than its opponent. That can come through first downs, converting third downs, staying ahead of the first down marker, running the football effectively, or simply avoiding possessions that end after three or four plays.
It also has a defensive component. If your offense is staying on the field and your defense is getting off the field, you are controlling the game.
Historically, teams with a positive time of possession margin won 66.3% of games, excluding ties. 1,821 wins, 927 losses, and 10 ties over the 2016 through 2025 NFL seasons, including playoffs.
That number by itself isn’t the point.
The real value of possession shows up when we start combining it with efficiency.
Key #2: Win the Toxic Differential
This is probably the most destructive of the three. A metric stemming from the mind of Cody Stoots owner of HOU Football.
The concept of toxic differential has been around football for years, although definitions can vary slightly. At its core, it combines two of the fastest ways to change a football game:
The simple explanation for Toxic Differential is creating and limiting turnovers, and creating and limiting explosive plays. The metric measures the difference between Turnovers Created + Explosive Plays against Turnovers Lost + Explosive Plays Allowed.
A turnover can immediately end an opponent’s scoring opportunity while creating an additional possession for your offense.
An explosive play can eliminate six, eight, or ten plays worth of offensive work in a matter of seconds. A 45-yard completion doesn’t care that your offense was struggling to generate four yards per play during the previous two possessions. The field just flipped.
That is why I like toxic differential more than simply looking at turnover margin.
Turnovers are enormously important, but explosive plays matter too.
If one team protects the football while consistently producing chunk plays — and prevents the opponent from doing the same — it has created a huge mathematical advantage.
Teams with a positive toxic differential won 75.2% of games, excluding ties, over the 2016 through 2025 NFL seasons including playoffs.
But even that doesn’t completely describe who played better.
A team can lose the explosive-play battle and still move the football efficiently throughout the game.
That brings us to the third metric.
Key #3: Win Down-to-Down
Net success rate might be my favorite of the three because it helps strip away some of the noise.
Success rate asks a relatively simple question:
Did the play accomplish what the offense needed it to accomplish based on the situation? Is the team moving the sticks? Is the team creating sustainable situations on 2nd and/or 3rd down? Are first downs generated consistently?
It isn’t simply about yards.
A five-yard gain on third-and-4 is successful. A five-yard gain on third-and-12 isn’t.
Net success rate then compares your offensive success rate against your opponent’s offensive success rate.
If your number is positive, your team was more efficient play by play basis. This matters because explosive plays can distort traditional box-score statistics.
Imagine two offenses: One generates several explosive plays but spends much of the afternoon struggling to stay ahead of the chains. The other consistently generates successful plays, stays in manageable down-and-distance situations, and sustains drives.
Net success rate starts to tell us which offense was actually winning snap after snap.
In our data, teams finishing with a positive net success rate won 67.0% of their games over the 2016 through 2025 NFL seasons, including the playoffs.
Now let’s put everything together.
What Happens When You Win All Three?
This is where the analysis gets interesting.
Instead of asking whether one particular statistic predicts winning, I separated games by how many of our three keys a team achieved.
A team could finish with:
0 of 3
1 of 3
2 of 3
or
3 of 3
Then I compared that against the actual game result with clear results:
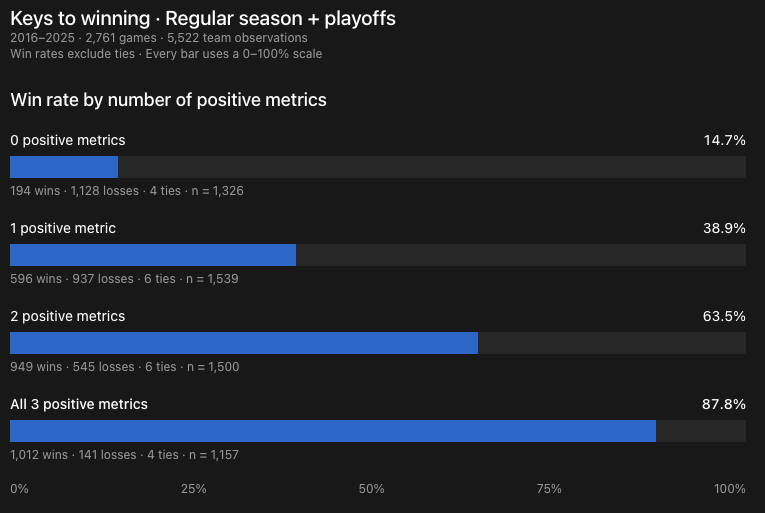
An 87.8% win rate when achieving all three positive metrics! This is the outcome every team is looking for.
Because these aren’t three versions of the same statistic. They are measuring three different parts of football:
Possession tells us who controlled opportunities.
Toxic differential tells us who won the high impact plays.
Net success rate tells us who won down-to-down efficiency.
Put another way:
Control the football. Create more damage than your opponent. Win more snaps than your opponent.
Do all three and it becomes very difficult to lose.
What happens when a team only achieves two positive metrics out of the three? Which two are the most important when combined together?

Toxic differential is the strongest indicator when combined with either time of possession or net success rate.
The Game Behind the Box Score
One reason I wanted to look at this is because postgame analysis can become overly focused on the final score.
A team wins, so everything must have worked. A team loses, so everything must have been bad.
Football usually isn’t that simple. These three metrics give us a different way to evaluate a game. Maybe a team lost the time of possession battle but dominated success rate and toxic differential. That tells us something.
Maybe a team won despite losing two of the three categories. That tells us something too.
It doesn’t invalidate the win. But it might suggest that the game was much closer, or more dependent on a handful of plays, than the final score indicates.
The same works in reverse.
A team can lose while winning two of the three categories. That is usually when I want to go back and figure out what happened.
Was there a red zone failure? A missed field goal? A defensive touchdown? A fourth down decision? A penalty that erased an explosive play?
The three keys aren’t designed to replace film study or traditional analysis.
They help tell us where to look.
Not a Formula — A Framework
There is an important distinction here.
I wouldn’t say:
Win these three statistics and you are guaranteed to win the game.
Football doesn’t work that way. What the data gives us is a framework.
When a team controls possession, creates a positive toxic differential and wins net success rate, it has generally done the things we associate with winning football.
It stayed on the field. It created or prevented game-changing plays. And it was more efficient than its opponent from snap to snap.
More importantly, the probability of winning increased dramatically as teams moved from achieving none of the three keys to achieving all three.
Because instead of reducing football to one magic statistic, we’re measuring three different ways a team can control a game.
The Three Keys
So going forward, these are three numbers I’m going to keep an eye on every week:
1. Time of Possession Margin
Did you control the football?
2. Toxic Differential
Did you win the turnover and explosive-play battle?
3. Net Success Rate
Did you outperform your opponent on a down-to-down basis?
None of them is perfect. Football statistics rarely are.
But if a team consistently finishes on the positive side of all three, chances are we aren’t going to spend much time debating whether that team deserved to win.
The scoreboard will usually have already answered the question.
Thanks for reading and your continued support!
-TC
Data sourced from the 2016 through 2025 NFL seasons from NFLVerse and TruMedia Sports.